On June 27, 2016 the EU Commission published the long awaited Starbucks State Aid decision (see here). The EU Commission’s decision challenges the outcome of the Advanced Pricing Agreement (APA) between the Netherlands Tax Authority (Tax Authority) and Starbucks Manufacturing BV (SMBV), a wholly owned and controlled coffee roasting operation.
Below is the Part I of a series of posts, each one covering several issues of analysis of the transfer pricing aspects of the Starbucks decision (I will not address State Aid). I am undertaking my own comparability study for the Starbucks roasting operation with the great research and discussion assistance of two Texas A&M University transfer pricing graduate students: Nima Khodakarami (Texas A&M Agricultural Economics) and Carlos Navarro Perez (Texas A&M Bush School Economics) who are going to become great transfer pricing staff upon graduation. Please reach out to us with any suggestions for acquiring comparability data and comparability studies (I will be at the NABE transfer pricing conference in DC in July and at IFA in Madrid in September). I hope to submit a draft of an academic article of our findings to reviewers shortly after IFA.
Starbucks Roasting Operation in the Netherlands
Starbucks Manufacturing BV (SMBV), based in the port of Amsterdam, the Netherlands, is the only coffee roasting company in the Starbucks group in Europe. SMBV sells and distributes roasted coffee and coffee-related products (e.g. cups, packaged food, pastries) to Starbucks corporate owned shops, franchise shops, and other sales outlets in Europe, the Middle East and Africa. In 2002, Starbucks set up the SMBV 94,000 square feet roasting facility that houses equipment and operations to receive, roast, package, and ship Starbucks coffee to retail stores in current and emerging markets.
SMBV’s facility and roasting operation was based upon Starbuck’s experience with its two U.S. roasting facilities in Kent, Washington, and York, Pennsylvania. In Spring of 2003 Starbucks opened a U.S. roaster in Carlson Valley, Nevada, followed by a roaster on Sandy Run, South Carolina in 2008, and Augusta, Georgia in 2014. In 2013, Starbucks opened, as a fifty percent joint venture partner with Tata, a roaster in Kushalnagar, India.
Starbucks and the United Kingdom Public Outcry
In 2012, the United Kingdom (U.K.) press reported that Starbucks in the previous 14 years had only paid £8.6m of tax.[1] In 2013, a Starbucks tax advisor from Deloitte dismissed the allegation that transfer pricing played a significant role in the reduction of the tax base because he claimed the intra-group charges were relatively small compared to the revenue.[2] He instead put forward that the U.K. government’s Business Secretary, Sir Vince Cable, examined the Starbucks tax situation and discovered that Starbucks was “losing money in the U.K. because their rents are much higher than some of their competitors and their staff costs are high.”[3]
Troy Alstead, Starbucks’ Global Chief Financial Officer, testified to a U.K. Parliamentary Committee that that Starbucks had lost money 13 of the previous 14 years because its occupancy costs in the U.K. are two and a half times higher than in its U.S. business.[4] He stated that Starbucks U.K. paid a 20 percent markup on the cost of roasted beans to Starbucks Switzerland’s sourcing operation. He also stated that the U.K. operation paid a six percent royalty for Starbucks intangibles to Starbucks licensing company in Netherlands, of which half was forwarded to the U.S. He justified the six percent royalty as compensation for the half-billion dollar investment of development costs borne primarily in the U.S., and based on Starbucks’ arms’ length agreements with third parties.
The U.K. press and government inquiry led the EU Commission to request on July 30, 2013 the Netherlands tax authority to provide information on the tax ruling practice in the Netherlands as well as all rulings related to Starbucks Coffee BV and SMBV.
The Advance Pricing Agreement (“APA”)
APAs are arrangements that determine, in advance of intra-group transactions, an appropriate set of criteria (e.g. method, comparables and appropriate adjustments thereto, critical assumptions as to future events) for the determination of the transfer pricing for those transactions over a fixed period of time.[5]
On April 12, 2001 SMBV and the Netherlands tax authority entered into an advance pricing agreement (Vaststellingsovereenkomst APA) (“APA”) which was adjusted and clarified in 2002 and 2004. That agreement formed the basis of the next APA entered into on April 28, 2008 to cover a ten year period of October 1, 2007 until December 31, 2017.[6] The APA has a clause that as of its sixth year (2013) the facts and circumstances upon which it is based will be re-validated by Starbucks.
Starbucks’ tax adviser prepared a transfer pricing analysis in a transfer pricing report that Starbucks submitted to the Netherlands tax authority. The transfer pricing report presents a company overview, a functional analysis and a selection of transfer pricing methods.
The APA consists of two elements. The primary element regards the determination of the arm’s length remuneration for SMBV for its functions performed of roasting and logistics/distribution (the “services” element). The secondary element regards a royalty payment to a Starbucks group partnership, Alki LP, for intangibles such as process and distribution know how and for Starbucks branding.
Co-Packer Aspect of APA
For the roasting and logistics/distribution services element of the APA, Starbucks’ tax advisor’s transfer pricing report describes SMBV as primarily a processor of green coffee that and sells roasted coffee to affiliated and non-affiliated parties. SMBV also performs associated supply chain operations (“SCOs”) include procurement, planning, logistics, and distribution planning.[7] SCOs consist of green coffee requirements planning, sourcing and buying; coffee roasting and the distribution of roast coffee; and the sourcing and supply of other products and supplies. Starbucks and the Netherlands tax administration agreed to treat SMBV like a contract manufacturer, which is known as a “co-packer” within the food industry.[8]
The green beans are purchased from Starbucks Coffee Trading Company SARL (“SCTC”) in Switzerland which buys those beans for the benefit of the entire Starbucks corporate group worldwide and its independent licensees. More than seventy-five percent of the world’s coffee, as a commodity, is sourced and traded via Switzerland intermediaries. Thus, while Switzerland probably offers the advantage of a low effective corporate income tax rate, it is also the hub of coffee commodities.
Method selected to determine an arm’s length relationship
The EU Commission summarized the five methods included in the OECD Transfer Pricing Guidelines (hereinafter the “OECD Guidelines”) that may approximate an arm’s length pricing of transactions and profit allocation between companies of the same corporate group:[9]
- the comparable uncontrolled price method (hereinafter “CUP”);
- the cost plus method;
- the resale minus method;
- the transactional net margin method (hereinafter “TNMM”) and
- the transactional profit split method. The OECD Guidelines draw a distinction between traditional transaction methods (the first three methods) and transactional profit methods (the last two methods).
Then the EU Commission distinguished between the three traditional transactional methods and the two transactional profit methods.[10]
Traditional transaction methods are regarded as the most direct means of establishing whether conditions in the commercial and financial relations between associated enterprises are at arm’s length. All three traditional transaction methods approximate an arm’s length pricing of a specific intragroup transaction, such as the price of a certain good sold or service provided to a related company. In particular, the CUP method consists in observing a comparable transaction between two independent companies and applying the same price for a comparable transaction between group companies. The cost plus method consist in approximating the income from goods sold or services provided to a group company. The resale minus method consists in approximating the costs of goods acquired from or services provided by a group company. Other elements which enter into the profit calculation (such as personal costs or interest expenses) are calculated based on the price effectively paid to an independent company or are approximated using one of the three direct methods.
The transactional profit methods, by contrast, do not approximate the arm’s length price of a specific transaction, but are based on comparisons of net profit indicators (such as profit margins, return on assets, operating income to sales, and possibly other measures of net profit) between independent and associated companies as a means to estimate the profits that one or each of the associated companies could have earned had they dealt solely with independent companies, and therefore the payment those companies would have demanded at arm’s length to compensate them for using their resources in the intra-group transaction. For this purpose, the TNMM relies on a net profit indicator which refers, in principle, to the ratio of profit weighted to an item of the profit and loss account or of the balance sheet, such as turnover, costs or equity. To this selected item, a margin is applied which is considered “arm’s length” to approximate the amount of taxable profit. When the TNMM is used in combination with a net profit indicator based on costs, it is sometimes referred to as “cost plus” in exchanges between the taxpayer and the tax administration, but this should not be confused with the “cost plus method”…
Starbuck’s tax advisor, for the Starbucks transfer pricing report prepared to negotiate the APA, chose to use the transactional net margin method (“TNMM”) as the preferred transfer pricing method to benchmark the operating performance of SMBV. The OECD Guidelines state that the TNMM may be used in the situation whereby one group member adds the value (“all unique contributions”) in the controlled transaction.[11] However, if both group members add value, then the OECD Guidelines state that the most appropriate method is the transactional profit split method. If the TNMM is the chosen method, then the OECD Guidelines state that the less complex group member should be the “tested” party for purposes of the analysis.
The EU Commission referred to the OECD Guidelines regarding the TNMM which state:
The transactional net margin method examines the net profit relative to an appropriate base (e.g. costs, sales, assets) that a taxpayer realises from a controlled transaction (or transactions that are appropriate to aggregate… Thus, a transactional net margin method operates in a manner similar to the cost plus and resale price methods. This means in particular that the net profit indicator of the taxpayer from the controlled transaction (or transactions that are appropriate to aggregate..) should ideally be established by reference to the net profit indicator that the same taxpayer earns in comparable uncontrolled transactions, i.e. by reference to “internal comparables” …. Where this is not possible, the net margin that would have been earned in comparable transactions by an independent enterprise (“external comparables”) may serve as a guide … . A functional analysis of the controlled and uncontrolled transactions is required to determine whether the transactions are comparable and what adjustments may be necessary to obtain reliable results.
Determining the TNMM Mark-Up for SMBV (Roaster) as a Co-Packer Operation
Starbucks and the Netherlands tax administration agreed a remuneration for SMBV, apparently as a co-packer, of a mark-up within a range of nine to twelve percent of SMBV’s costs. Starbucks’ tax advisor proposed that the underlying costs only for which SMBV performs a value added role should form the basis of the pool for which the markup would be applied.[12] Thus the pool consisted of:
- costs of personnel employed for manufacturing,
- costs associated with its supply chain activities,
- costs of production equipment such as depreciation, and
- costs of plant overheads.
SMBV excluded from its cost pool, for purposes of applying the remuneration mark-up, the Starbucks cups, paper napkins, etc., the costs of green coffee beans (cost of raw materials), the logistics and distribution cost for services provided by third parties, the remuneration for activities provided by third parties under so-called “consignment manufacturing contracts”, and the royalty payments to Alki LP. The EU Commission challenged the tax advisor’s exclusions, stating that the distinction between costs that pertain to value added-activities and costs that would not pertain to such activities does not exist in accounting rules, and that such classification of costs relies solely on the judgment of the tax advisor, and not upon the OECD Guidelines.
TNMM and OECD Guidelines
According to the OECD Guidelines, the TNMM examines the net profit relative to an appropriate base (e.g. costs, sales, assets) that a taxpayer realizes from intra-group transactions. In order to be applied reliably, the net profit indicator of the taxpayer from the intra-group transaction should be established by reference to the net profit indicator that that same taxpayer earns in comparable transactions with independent companies. Where this is not possible, the net margin that would have been earned in comparable transactions by an independent company may serve as a guide. A functional analysis of the intragroup and independent transactions is required to determine whether the transactions are comparable and what adjustments may be necessary to obtain reliable results
Licensing Aspect of APA
For the royalty element of the APA, Starbucks and the Netherlands tax administration agreed that the “residual profit” remaining after the application of the mark-up would determine the annual license fee due Alki LP. SMBV took legal title to its raw materials (the green coffee beans) by purchasing them from a Starbucks sourcing company in Switzerland (“SCTL”). After the roasting, Starbucks sold the finished, packaged product to the Starbucks controlled shops and affiliates at a price higher than it paid to purchase. Thus SMBV’s accounting profit each year exceeded its APA remuneration. Consequently, SMBV paid a changing license fee each year of the residual that depended on the amount of its finished product bought by the group.
The OECD Guidelines state that:[13]
A residual analysis divides the combined profits from the controlled transactions under examination in two stages. In the first stage, each participant is allocated an arm’s length remuneration for its non-unique contributions in relation to the controlled transactions in which it is engaged. Ordinarily this initial remuneration would be determined by applying one of the traditional transaction methods or a transactional net margin method, by reference to the remuneration of comparable transactions between independent enterprises. Thus, it would generally not account for the return that would be generated by any unique and valuable contribution by the participants. In the second stage, any residual profit (or loss) remaining after the first stage division would be allocated among the parties based on an analysis of the facts and circumstances.
The OECD states that the criteria or allocation keys used to split the residual profit should be:[14]
- reasonably independent of transfer pricing policy formulation, e. they should be based on objective data (e.g. sales to independent parties), not on data relating to the remuneration of controlled transactions (e.g. sales to associated enterprises), and
- supported by comparables data, internal data, or both.
What Is the Value of Starbucks Roasting “Know How”?
The Netherlands Tax Authority (NTA) responded to the EU Commission that within the Dutch tax system profit is taxed where the value leading to that profit is created. The NTA contended that it concluded an APA with SMBV for an arm’s length business remuneration for the value of SMBV as a coffee bean roasting operation. The NTA collects taxes on profit made by SMBV for roasting coffee beans. Because the intellectual property rights of Starbucks are not located in The Netherlands, the NTA contends that the royalties for the use of these IP rights cannot be taxed in The Netherlands.
The NTA, acting in accordance with the international OECD framework for transfer pricing, agreed with Starbucks that it may apply the TNMM to determine an arm’s length result to attach to its Netherlands based activities. The TNMM requires that members of multinational enterprises be treated as independently operating national enterprises: profits are taxed wherever value is created, attaching to the specific enterprise of the activity creating the value.
The Commission alleges that the payment of royalties by SMBV to the Starbucks UK subsidiary (Alki) owning the “know-how” intellectual property rights does not provide a correct representation of the value of the intellectual property rights and therefore cannot be deemed to be arm’s length. This incorrect representation led Starbucks to exaggerate the value attaching to its coffee bean roasting “know-how”, in turn leading to an excessive royalty payment.
Understanding the Coffee Industry to Contextualize Potential Comparables and Starbucks’ IP Value
This next section represents some of the research that we are doing to be able to understand the coffee industry supply chain and differentiation within the industry for purposes of identifying business know how and its potential value.
Coffee is grown in tropical and subtropical regions around the equator. The two types of coffee plants widely cultivated are Robusta and Arabica. Ripe coffee cherries are harvested manually and undergo primary processing in the producing country before they are exported. The primary processing is carried out to separate the coffee bean from the skin and pulp of the cherry. There are two alternative methods for doing this: wet and dry. The end products of both methods are coffee beans, referred to in the trade as “green” coffee. Wet processing produces “mild” coffee, usually of the Arabica type, and the dry method produces “hard” coffee, either Hard Arabica or Hard Robusta. The distinction is important as Mild Arabica, Hard Arabica, and Hard Robusta coffees are traded separately.[15]
The Value Chain for Coffee[16]
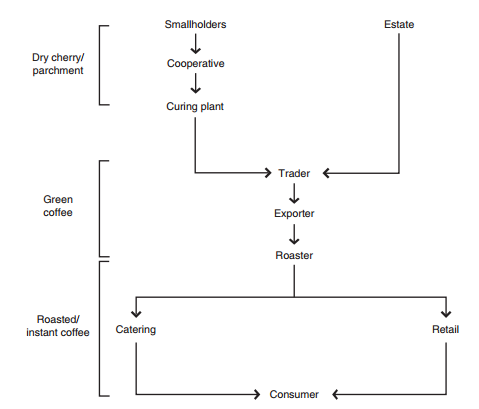
Source: Supply Chains in Export Agriculture, Competition, and Poverty in Sub-Saharan Africa
Brazil, Vietnam, Colombia, Indonesia, and Ethiopia are the main producers and exporters of green coffee, with Brazil’s share close to one-third of the total market. Uganda, Côte d’Ivoire, and Kenya are also among the top twenty exporting nations. Most of the coffee produced is consumed in high-income countries. The United States, Germany, Italy, Japan, and France are the top five importers.
More than 80 percent of the production is traded internationally as green coffee, generally packed in 60 kg bags. Green coffee is available to buyers either directly or via the spot markets in the United States and Europe. International buyers are generally concerned with the uniformity and consistency of green coffee and they require information on the type of coffee, the type of primary processing, the country of origin, and the official grade standard.
Globally, coffee for home consumption is mostly purchased in supermarkets. The food retail sector is highly concentrated in the United States, the United Kingdom, and Northern Europe and plays a dominant role in the food marketing chain. There is also an important and growing market for special- ties and product differentiation that is been exploited by smaller producers.
Within the EU, the most important forms in which coffee is consumed are:
Ground roasted coffee – this coffee, used for filter coffee systems, or in coffee pods, is still the principal type of coffee consumed in the EU.
Roasted coffee beans – With the increasing prevalence of espresso and cappuccino systems sold for use in the household, direct sales of roasted coffee beans are increasing fast. The increasing number of coffee bars is also strengthening this trend.
Decaffeinated coffee – the International Trade Centre (ITC) estimated that decaffeinated coffee accounts for around 10 percent of all coffee sales. Decaffeinated coffee is losing share, as caffeine no longer appears to be an issue of particular concern to most consumers. However, in some South European countries decaffeinated is still an ongoing trend and lightly caffeinated coffees are gaining ground in several European markets. With production predominantly taking place in the EU, this is of limited interest to developing country producers.
Soluble or instant coffee – The share of soluble coffee in the total coffee consumption varies considerably among EU member countries.
Ready-to-drink coffee – Less important than in the US market, but upcoming in the EU along with the trend towards convenience food product, are ready-to-use coffee drinks like iced coffee. These are mostly produced in the EU. This is also of importance in the catering sector.
Flavored coffee – An interesting and fast growing area of the market is flavored coffees. These unique coffee blends are increasingly popular. Adding the flavors to the coffee is done by European roasters and, as such, this market niche offers few opportunities for developing country producers.[17]
The Coffee Global Supply Chain[18]
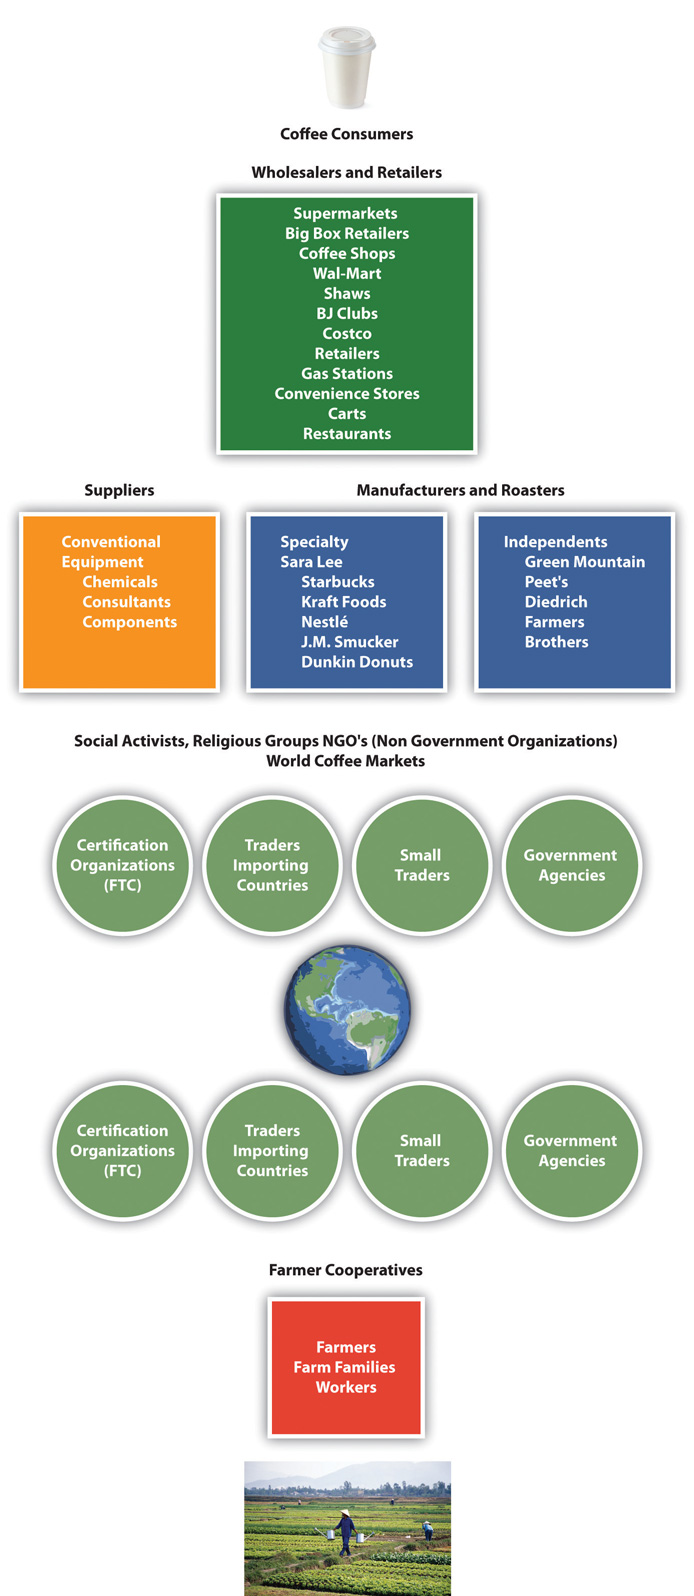
Source: The Sustainable Business Case Book
Understanding the EU Coffee Roasters Market
Coffee roasters and instant coffee manufacturers transform the coffee from green beans to roasted and instant. This roasting process usually takes place in consumption countries and in the EU it is done to a large extent by multinationals supplying several EU countries from their production facilities. The level of concentration within the roasting sector exceeds the level of concentration in the coffee trade itself. Some of the largest European roasters also maintain their own in-house buying companies (e.g. Taloca for Kraft) i.e. they import coffee directly from origin, or they export coffee from origin. The Italian specialty roaster Illy also has important upstream operations, eg. in Brazil.
The largest roasting companies are: Nestlé, Procter and Gamble, Sara Lee, Kraft, Tchibo. These five are responsible for more than two-thirds of the roasted coffee market. In 2002, Europe, Nestlé and Kraft (with companies such as Jacobs Kaffee, Gevalia, Grand Mere and Carte Noire) controlled almost 60 percent of the global market for roasted and instant coffees. Nestlé, Procter and Gamble, Sara Lee, Kraft, Tchibo are responsible for more than two-thirds of the roasted coffee market. The largest roasters (those with the largest market authority) usually tend to rely heavily upon traders for their supply of coffee rather than dealing directly with producers or producer groups. Smaller roasters and particularly those serving the specialty coffee sector exhibit a greater tendency to deal directly with producers and their organizations in order to secure their supplies.
The ‘sustainable chains’ (including fair trade and other certifications) tend to be shorter than conventional food chains. They usually include a group of farmers, an exporter, an importer/distributor and a specialized retailer. In some cases, the chain is even shorter when the group of producers exports directly to a roaster or even a retailer (see figure below). This type of short chains is typical of the fair-trade sector, where the declared goal is to reduce the number of middlemen to increase the profit margin at farm gate level. This integration, which has been facilitated by rapid progress in information and communication technology, leads to increased profit margins at both ends of the chain. Some examples of (partly) sustainable economic actors / brands in Europe are: Sara Lee, Ahold Coffee Company,
Some examples of (partly) sustainable economic actors / brands in Europe are: Sara Lee, Ahold Coffee Company, Friele, Autobar and Coop Norge (UTZ Certified); Kraft, Tchibo, Costa Coffee, Drie Mollen, Dallmayr (Rainforest Alliance); Oxfam, Fair-trade Original, Ethiquable, Java (Fair Trade); Hacofco, ECOM, Volcafe, DEK/Cafea, Inter American Coffee, Gepa, Benecke, OXFAM, Douqué, Twin Trading, EFICO, Rucquoy (organic coffee). Within the EU, 4C concerns traders such as Armajaro and Ecom, large roasters such as Nestlé, Kraft and Sara Lee and retailers such as COOP and Lidl. Some private companies such as Starbucks and Nestle, have developed and implemented their own verification system. Starbucks has developed Coffee and Farmer Equity (C.A.F.E.) Practices. Nestle’s AAA Sustainable Quality Program draws on its relationships with its suppliers and partners.
Ethiopian Coffee Supply Chain
Taloca is one of them who buy coffee for Kraft Food; Volcafe is buying for Nestle and also for Starbucks; Dallmayr is also another big buyer in Europe. It is based in Germany and buys arabica coffee for different rosters around the world. There are also other companies like Asda in UK and Peace Coffee in Minneapolis. All these companies buy and roast the coffee within their group. They have representatives in Ethiopia and they will closely follow the bid price via phone. Once the coffee is bought from Ethopia, the coffee buyers or the coffee exporters unload the coffee at their warehouse and they process and sell it to their buyers abroad. Then the buyer distributes the coffees to roasters, which in turn roast the coffee and sell it to retailers and consumers. This implies that the coffee reaches to the end consumer after it passes through multiple parts of the supply chain.[19]
Mapping of coffee generic functions in Ethiopia[20]
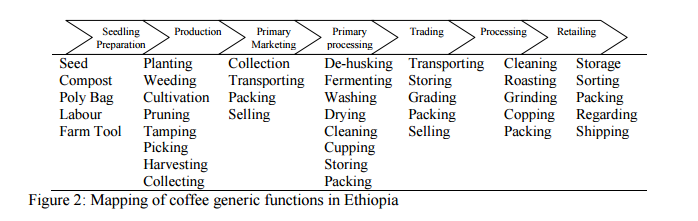
Source: Journal of Agriculture and Social Research, Vol. 13, No.2, 2013
Coffee Supply chain in Indonesia[21]
Source: Nestle, 1999; Suhendra, 2008; Ibrahim and Zailani, 2009; Baburrayyan, 2008.
Dallmayr Coffee Supply Chain
Dallmayr carefully selects and then sources its beans from the world’s prime coffee-producing areas, thereafter roasting its beans at Dallmayr’s facility in Giesing. Noteworthy varieties include the Sigri Estate arabica roast from Papua New Guinea and San Sebastian from the highlands of Guatemala. (http://www.dallmayr.com/)
Business Process IP and Bean Sourcing
The five major national brands, Jacobs, Melitta, Dallmayr, Tchibo, and Eduscho, together comprise about 70% of the market.[22] A recent survey of the social and environmental commitment (Corporate Social Responsibility (CSR)) of 19 German coffee providers and 31 roasted coffees revealed that the major coffee companies operating in Germany, like Kraft Foods, Tchibo, Dallmayr and Melitta only rudimentarily commit to a sustainable coffee sourcing and often can only track their coffee source to the importer (see below figure).[23]
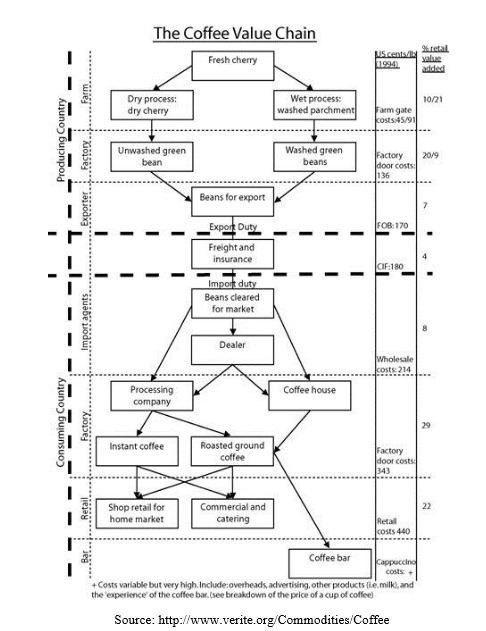
Source: http://www.verite.org/Commodities/Coffee
Professor William Byrnes is the author of a leading transfer pricing treatise. Citation of Sources Below
[1] “Vince Cable acknowledges public outrage over tax avoidance”, Matthew Sparkes, Telegraph, Nov 18, 2012. Available at http://www.telegraph.co.uk/finance/personalfinance/tax/9686032/Vince-Cable-acknowledges-public-outrage-over-tax-avoidance.html (accessed June 27, 2016).
[2] “Starbucks are right to pay no tax in UK: Coffee chain’s adviser Deloitte sparks fresh row after defending claim it makes no profit”, Matt Chorley And Becky Barrow, Daily Mail, April 25, 2013. Available at http://www.dailymail.co.uk/news/article-2315009/Starbucks-right-pay-tax-UK-Coffee-chains-adviser-Deloitte-sparks-row-defending-claim-makes-profit.html#ixzz4Czhbwgam (accessed June 27, 2016).
[3] I did not find a report wherein Sir Vince Cable agreed or disagreed with this contention by Deloitte’s tax partner.
[4] HM Revenue and Customs: Annual Report and Accounts Public, Public Accounts Committee – Nineteenth Report, November 28, 2012. Accounts Committee – Minutes of Evidence Public Accounts Committee on Monday November 12, 2012. Available at http://www.publications.parliament.uk/pa/cm201213/cmselect/cmpubacc/716/121112.htm (accessed June 27, 2016).
[5] State aid SA.38374, C (2014) 3626, June 11, 2014 final – Netherlands Alleged aid to Starbucks, at p. 2.
[6] Comm. Dec. on State Aid SA.38374 (2014/C ex 2014/NN) (Oct 21, 2015) (published June 27, 2016) at 7.
[7] State aid SA.38374, C (2014) 3626, June 11, 2014 final – Netherlands Alleged aid to Starbucks, at p. 12.
[8] I am unclear if a co-packer would also undertake all the SCOs? My instinct seems the residual should be split between the companies SMBV and Alki if SMBV potentially undertakes some inventory risks, or the residual must be justified a royalty paid based on a fixed %. Have not found a residual agreement yet that simply clawed back all income beyond the TNMM.
[9] State aid SA.38374, C (2014) 3626, June 11, 2014 final – Netherlands Alleged aid to Starbucks, at p. 4.
[10] State aid SA.38374, C (2014) 3626, June 11, 2014 final – Netherlands Alleged aid to Starbucks, at p. 4.
[11] OECD Transfer Pricing Guidelines for Multinational Enterprises and Tax Administrations 2010, OECD (2010) at para. 2.59. Available at http://dx.doi.org/10.1787/tpg-2010-en (accessed June 28, 2016).
[12] State aid SA.38374, C (2014) 3626, June 11, 2014 final – Netherlands Alleged aid to Starbucks, at p. 13.
[13] Review Of Comparability And Of Profit Methods: Revision Of Chapters I-III Of The Transfer Pricing Guidelines, OECD, July 22, 2010 at p. 46.
[14] Review Of Comparability And Of Profit Methods: Revision Of Chapters I-III Of The Transfer Pricing Guidelines, OECD, July 22, 2010 at p. 48.
[15] See Tropical Commodity Coalition www.teacoffeecocoa.org (accessed July 1, 2016).
[16] Supply Chains in Export Agriculture, Competition, and Poverty in Sub-Saharan Africa (2011), Guido Porto, Nicolas Depetris Chauvin and Marcelo Olarreaga.
[17] European and Belgian market for certified coffee (2010), Katrien Van Dingenen, Marie-Laure Koyen, Freek-Jan Koekoek, Joost Pierrot, Daniele Giovsnnucci.
[18] The Sustainable Business Case Book, Ross Gittell, Matt Magnusson, and Michael Merenda. Available at http://catalog.flatworldknowledge.com/bookhub/reader/3157?e=gittell_1.0-ch07_s02 (accessed July 1, 2016).
[19] Available at http://www.diva-portal.se/smash/get/diva2:435908/FULLTEXT01.pdf (accessed July 1, 2016).
[20] Daniel Kitaw, Tirufat Dejene and Birhanu Beshah, Quality And Value Chain Analyses Of Ethiopian Coffee (2013).
[21] Hadiyan Wijaya Ibrahim and Suhaiza Zailani, A Review on the Competitiveness of Global Supply Chain in a Coffee Industry in Indonesia, International Business Management (2010).
[22] Michaela Draganska and Daniel Klapper, Choice Set Heterogeneity and the Role of Advertising: An Analysis with Micro and Macro Data (2010).
[23] Claudia Rosina Bara, Coffee Trade Between Mexico And Germany, Status quo, challenges and opportunities an alternative coffee production, consumption and trade, Universidad Autónoma de San Luis Potosí (2012).
________________________
To make sure you do not miss out on regular updates from the Kluwer International Tax Blog, please subscribe here.