I want to talk about TP documentation. If what I say seems a little crazy, then at least of part of it is to be deliberately provocative. I attended a wonderful TP conference in London in March with many knowledgeable speakers, but one (shocking) question lingers in my mind. In a workshop, the workshop leader rhetorically asked “Let’s be honest, BEPS has not changed anything substantial for TP documents, has it?” Personally, I cannot disagree more, but I must also confess that this speaker may well represent the majority opinion, at least among advisors (especially those who approach TP as a “Give the company name and I will give you the database search” exercise). Generally, people hate change.
Country by Country Reporting
So, what is so different now? Obviously there is the Country by Country reporting (“CbyCR”), even our London speaker had to acknowledge that. But CbyCR has been embraced by many as a scaremongering and cash cow opportunity above anything else. It brings me back to a red line in many of my posts here and elsewhere: in-house tax departments need to get up to speed with IT and with intimately understanding their group’s financial systems, at the very least at the consolidated accounts level. I recently made a first draft CbyCR for a client where I am familiar with the financial system. 2015 took 3.5 hours from scratch (including cash tax). 2012 – 2014 another 20 minutes: the 2015 template was set up in such a way that I had to change the year only to pull the other years’ data. I grant you that:
• this did not include checking which companies joined or left the group during that time or which changed activities between 2012 and 2014;
• this group only has between 50 – 100 companies worldwide; and
• this first draft is not 100% accurate (but certainly more than 80).
Fact remains: if you know your group’s accounts, markets and activities dimensions, and if you know Hyperion Smart View formulas, life becomes a lot easier.
I had the opportunity to discuss my findings with a handful of heads of tax/TP of medium and large multinationals. In general, their experience of collecting data in the first instance was not that different. Their concerns were more about how the final data looked, how accurate their financial systems are, and how the data may be interpreted or misused. I find these concerns legitimate, but I also believe that it is impossible to predict all the ways in which authorities will or will not interpret CbyCR. Apart from glaring anomalies, sticking to the facts and dealing with the questions as they arise, seem to be the most efficient approach to me.
Master File
I am first and foremost a lawyer. So I stick to the literal wording of the original document much rather than to the random (even if majority) opinion of anyone else. Naturally, a deviant widely held opinion requires at least a second look at the root documents and an investigation as to whether anything else official has been missed.
So my Master File (“MF”) follows Annex I to Chapter V of BEPS Action 13: The MF chapter 1 is a 1 page group chart showing the country per company and mentioning that the group is listed; chapter 5 refers to the attach consolidated financial statements and lists unilateral APA’s and tax rulings with ten to thirty words descriptions for each. In between are lots and lots of numbers (many of which are in the published financial accounts in anyway). An overview:
• the group’s 8 largest products and their percentage of total group turnover are directly pulled from Hyperion into Excel and then hot linked to PowerPoint, in which the MF is made (change one cell in Excel and you get the same info for another year);
• Turnover for those products by largest markets. A one page Hyperion table with 30 data points. More information than several pages written in Word.
• Supply chain for largest products. Another one pager where product categories and supply chain functions are given for every operating company, based on their numbers in the financial system. This time there are 550 data points pulled in less than a minute which are far more accurate than relying on one or two in-house tax professionals’ knowledge of their group.
Some of the above data may be deemed too sensitive to be provided just like that. Running a macro in the background changes actual numbers to categories of numbers (e.g. changing 5,3 million to “4 – 8 million”). All of these can be updated in minutes for other scenarios or other years, because they are just derivatives of data pulled from the group financial system.
Much of the MF chapter 2 (“Description of MNE’s Business”), such as “profit drivers” is pulled straight from the group’s annual report. Important intercompany service agreements are listed in a table where each row represents one type of agreement, the service providers’ capabilities and TP policies for cost allocation and pricing. A similar table provides the “brief functional analysis” where each row represents data required from the new chapter 1.51, 60 or 72 of the TP Guidelines and each column a significant function (this takes more than 3.5 hours to complete). There is reason for doing it this way, and that is that I strongly believe that supply chain and value chain references made in the post BEPS TP guidelines are not meant as 10 line paragraphs to be added on top of the “old functional analysis”. No; a functional analysis is a subpart of a value chain analysis, not a sister part. It is something to be performed separately on every link in the chain, not something to be done outside the chain. But that is the topic for another blog.
Chapter 3 (“Intangibles”) mimics chapter 2 in several ways (e.g. a table for intercompany agreements). Many, but not all, intangibles and their owners can be found through the financial statements, especially in the “special” accounts which are typically listed below the group’s normal P&L and balance sheet items in the financial system’s accounts dimension.
There is no industry analysis in the MF, because – the way I read it – no industry analysis is asked for.
Local Files
The same rule applies here: follow what is asked for in Annex II to chapter V, don’t copy the old TP files and try and regroup them and see what’s missing; you will end up adding a lot of historical data that is not being asked for.
The local management structure? Pulled from SAP HR, as it was represented on the group intranet (yes, the intranet should then also be updated regularly). Key competitors? A trip down to the Marketing and Sales Department. Their 3-month old data is so much better than the existing 4-year-old chart.
And then comes the true power of understanding the group accounts and knowing just a bit of programming. With less than 200 lines of code, we pull all intercompany accounts for all group companies, with all their counter parties in an Excel workbook of 30 to 70 sheets (depending on the scenario). Each sheet represents one company and provides its transactions row by row in order of size and the counter parties sorted by size from left to right, i.e. the largest intercompany transaction per company starts in the top left row. Empty rows and columns are deleted automatically to enhance overview and reduce the workload on the financial data servers. A company sheet typically looks like this:
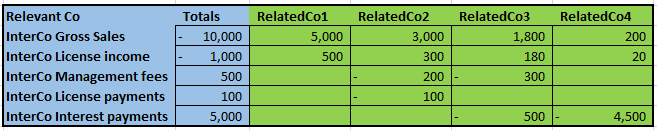
The whole exercise takes 5 – 8 minutes depending on the speed of the financial data servers. This sheet becomes the root of each local file’s description of controlled transactions. As we do more local files, we will start to recognise the duplications and automate them.
As this IT exercise cannot only be done per company, but also per account, similar sheets are manufactured with as much ease, e.g. for chapter 4 of the MF, “Intercompany financial activities”. That would look like this:
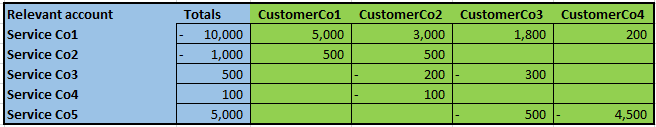
Obviously, there is a lot of written work to do in chapter 2 of the local files (“Controlled transactions”), which cannot just be pulled from the financial system. However, the company sheets described just before, do already cover the second and third bullets of that chapter. In addition, pulling this data by account instead of company (think e.g. “intercompany license fees received” or “management fees”) paves the way for making certain generic summaries to be used in the functional analyses.
The functional analysis per transaction will very much follow the table approach used and described for the MF “brief functional analysis” described here above, only with more rows and more data per cell. Many of the bullets in Chapter V, Annex II “Controlled transactions” will find their answers in that table.
And what about database searches? Well (let me be very provocative here), the tenth bullet of the referenced Annex II “Controlled transactions” use two magic words: “if any”, as in “A list and description of selected comparable uncontrolled transactions (internal or external), if any, …”. I will put the database searches on the back burner and focus on the facts instead. Database searches are a way to compensate for not knowing a group, it’s value chain(s) and its numbers. It is cosmetic and it can wait. It is the easy, template driven, alternative to a proper value chain analysis. Unless a group has something to obscure, it should be used as a reality check not as a primary TP motor.
Low value adding intragroup services and cost contribution agreements
I have not covered a description of how I would do the new TP documentation for low value adding intragroup services (“LVAIS”) and cost contribution agreements (“CCA’s”), simply because I have not gotten that far yet (though I looked at it closely for a client some months ago). There is a reason to treat LVAIS differently and that is that unfortunately the data required under the new paragraph 7.64 is not completely aligning with chapter V, Annex I and II. To benefit from the light brushed approach of chapter 7 (think e.g. of the one sided benefits test), one would have to present the data along the guidelines of 7.64. However, again: an understanding of the group accounts may go a long way towards demonstrating and justifying the allocation keys used and the calculations made. Similar concerns apply for CCA’s and subchapter VIII.E on documenting CCA’s.
I look forward to learning from any comments to this post.
________________________
To make sure you do not miss out on regular updates from the Kluwer International Tax Blog, please subscribe here.