To refresh memories, several months ago I posted part 1 of this study on Kluwer’s International Tax Blog: Application of TNMM to Starbucks Roasting Operation: Seeking Comparables Through Understanding the Market Part 1 briefly describes my advocated transfer pricing approach drawn from my transfer pricing law treatise and my corresponding research based upon it. My first step for a transfer pricing analysis is to understand the industry and its segmentation from a supply chain and global value chain perspective. Part 1 provides an overview of the fruit borne from my industry research and sources from which I derived it.
I continue to receive feedback, and requests for my completed study. My study is far from complete, but I thought it time to update in this part 2 the stakeholders briefly what I have managed to collect, and (very imperfectly) analyze. By no means do I imply that I have reached any conclusions though I have drawn a couple evidentiary based insights (see the last section of this post). My data and analysis requires critical peer review that will occur in November, allowing me December to pull together a publishable quality law review article. Meanwhile, please keep your feedback coming: williambyrnes@tamu.edu.
By brief background, on 27 June 2016 the EU Commission published the full length (redacted) Starbucks State Aid decision (see here). The EU Commission’s original release and full decision challenges the outcome of the ‘Advanced Pricing Agreement’ (APA) that entered into force from 28 April 2008 to cover a ten year period between the Netherlands Tax Authority (NTA) and Starbucks Manufacturing BV (SMBV), a wholly owned and controlled coffee roasting operation. The EU Commission found that Starbucks and the NTA had agreed to reduce, in a non arm’s length arrangement, the taxable base of SMBV by allowing overcharging for sourcing green beans and overcharging for intangible rights. The EU Commission ordered the NTA to recapture for the previous ten years the profit difference between what the Commission determined is an arm’s length arrangement and the APA arrangement, and to levy the appropriate Netherlands corporate tax rate. The NTA has appealed to the European Court of Justice that its APA with Starbucks is arm’s length, for which a decision will likely be rendered in late 2017. Several parties will submit the equivalent of amicus briefs. I intend to submit the results of this project as a law review article and to distribute it to the case’s stakeholders. A literature review and interview process did not find any similar study.
My research undertakes to determine an arm’s length range of the transactional net margin for SMBV’s roasting operations based on a comparison to its competitors with similar functions. The research required leveraging several commercial financial databases to pull a pool of approximately 800 potentially comparable coffee roasters. Thereafter, the comparable pool was reduced by knocking out non-like competitors. Profit level indicators, such as net income compared to assets, were determined for the remaining comparable taxpayers to SMBV.
Two Texas A&M University units extended to me a research assistant for my interdisciplinary research: Nima Khodakarami (Texas A&M School of Agriculture, was Master now pursuing PhD)
and Carlos Navarro Perez (Texas A&M’s Bush School Master). Both have been invaluable for collecting, sifting, crunching, and attempting to understand the data. I have a list of industry transfer pricing economists that have been and continue to be quite helpful and generous with their time, helping to challenge the assumptions, data, comparables, and analysis. I do not want to name any at this point until they have provided specific permission, so I thank them anonymously at this stage. For purposes of independence, I am not receiving any funding for this study. For disclosure, Texas A&M University is the home of the industry’s Coffee Research Institute that focuses
on Agribusiness issues.

Some thoughts about my filtering analysis for Starbucks roasting operation’s functions to be able to derive comparables.
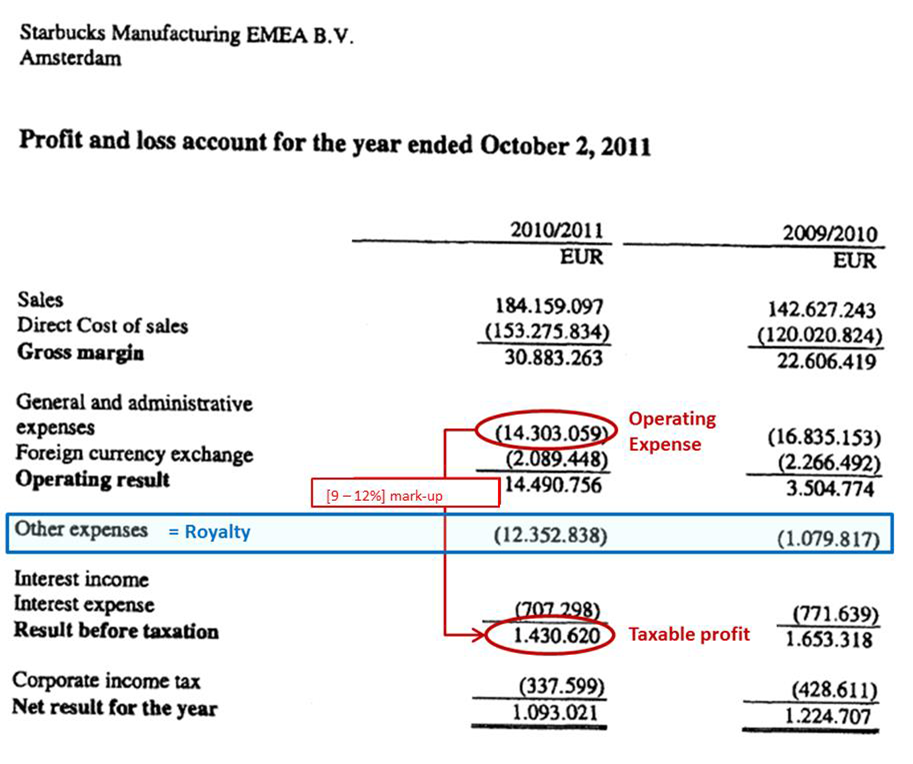
Starbucks Manufacturing BV (SMBV),based in the port of Amsterdam, the Netherlands, is the only coffee roasting company in the Starbucks group in Europe. SMBV sells and distributes roasted coffee and coffee-related products (e.g. cups, packaged food, pastries) to Starbucks corporate-owned shops, franchise shops, and other sales outlets in Europe, the Middle East and Africa. In 2002 Starbucks set up the SMBV 94,000 square feet roasting facility that houses equipment and operations to receive, roast, package, and ship Starbucks coffee to retail stores in current and emerging markets. SMBV’s facility and roasting operation was based upon Starbuck’s business know-how obtained from its experience with its two U.S. roasting facilities in Kent, Washington, and York, Pennsylvania. In Spring of 2003 Starbucks opened a U.S. roaster in Carlson Valley, Nevada, followed by a roaster on Sandy Run, South Carolina in 2008, and Augusta, Georgia in 2014. In 2013, Starbucks opened, as a fifty percent joint venture partner with Tata, a roaster in Kushalnagar, India. I have not yet sought to ascertain if these later roasting operations functions are reasonably comparable to SMBV, and if so, to obtain from public sources any financials to compare against SMBVs (a glaring omission on my part but much to do with this project and only so much time to do it within).
From an employment perspective, SMBV’s employees are approximately split between two primary functions: roasting coffee and supply chain (distribution / logistics of coffee and other Starbucks cafe products). Of 70-80 people cited to in the EU Commissions decision, approximately 40-50 persons in coffee roasting and 30-40 persons are involved with logistic and administrative.
For the roasting and logistics/distribution services element of the APA, Starbucks’ tax advisor’s transfer pricing report describes SMBV as primarily a processor of green coffee that sells roasted coffee to affiliated and non-affiliated parties. The green beans are purchased from Starbucks Coffee Trading Company SARL (“SCTC”) in Switzerland which buys those beans for the benefit of the entire Starbucks corporate group worldwide and its independent licensees. More than 60 percent of the world’s coffee, as a commodity, is sourced and traded via Switzerland intermediaries, dwarfing Hamburg at 20 percent, as well as New York and Singapore with only five percent of the global commodities market each. the according to a 2013 Switzerland Federal Council report. Thus, while Switzerland probably offers the advantage of a low effective corporate income tax rate, it is the hub of the trade of coffee as a commodity. Until 2011, Starbucks sourcing operation, according to the EU Commission, charged a three percent bean price markup. In 2011, Starbucks increased the markup to 18 percent. Starbucks explained its decision was at least partly based upon its sustainability, and sustainability branding program, called the “CAFÉ program”. There is ample evidence of comparable companies and Starbucks increasing linked expenditures to coffee bean source sustainability programs and their respective branding/marketing. How much, by industry comparable approach, additional value should spill into the sourcing and branding functions as a result bean remains open – but it not “nil”. I think it relevant that coffee commodities globally suffered a steep price increase approximately at the same time linked to a massive drought in Brazil, the global coffee export leader. This historical data is easier to collect.
SMBV also performs associated supply chain operations (“SCOs”) including procurement, planning, logistics, and distribution planning. SCOs consist of green coffee requirements planning, sourcing and buying; coffee roasting and the distribution of roast coffee; and the sourcing and supply of other products and supplies. Starbucks and the Netherlands tax administration agreed to treat SMBV as a low value service “toll manufacturer” (more often referred to as a “co-packer operation” within the food industry). Toll manufacturers, in general, carry little risk, with processes and source material provided by the contracting group and the substantial risk remaining with the group. A toll manufacturer attracts less portion of a value chain than other functions that bear more risk taking and/or more ownership of the value creation process.
The EU and Netherland/SMBV do not agree on which functions are controlled or exercised in The Netherlands and which are controlled or exercised within other group members. The EU Commission has determined that SMBV controls and exercises more supply chain functions than SMBVs contends. SMBV, I think, contends that all ancillary product sourcing and decision control is exercised elsewhere than SMBV and that SMBV is merely a low-value administrator taking instructions. My hypothesis at this stage is whichever perspective one chooses, or somewhere in between, some value is owed for every function. But that value is probably still low proportionally as an administrative low-risk function relative to the total value of the global value chain.
Starbucks’ tax advisor, as reported in the decision, used the NACE Code 1.1 (Nomenclature of Economic Activities) 15.86 for process of tea and coffee within the Amadeus database. The tax advisor’s query rendered 240 companies, from which the tax advisor excluded 88 non-comparable tea and coffee processors. The remainder companies used for the pool yielded an Operating Profit / Total Operating Costs median net margin of 7.8 percent. However, Starbucks’ tax advisor proposed that the underlying costs only for which SMBV performs a value-added role should form the basis of the pool for which the markup would be applied. Thus the pool consisted of:
- costs of personnel employed for manufacturing,
- costs associated with its supply chain activities,
- costs of production equipment such as depreciation, and
- costs of plant overheads.
SMBV excluded from its cost pool, for purposes of applying the remuneration mark-up:
- the costs of green coffee beans (cost of raw materials),
- the logistics and distribution cost for services provided by third parties,
- the Starbucks cups, paper napkins, etc.,*
- the remuneration for activities provided by third parties under so-called “consignment manufacturing contracts”,* and
- the royalty payments to Alki LP.
It is important to note that half of the sales revenue attributed to SMBV is generated from non-coffee sales that are booked for invoice consolidation convenience by SMBV. Starbucks alleges that these ancillary activities are not part of a “roasting” operation. The administration itself, Starbucks contends, is a low margin activity. The EU Commission challenged the tax advisor’s exclusions, stating that the distinction between costs that pertain to value-added activities and costs that would not pertain to such activities does not exist in accounting rules and that such classification of costs relies solely on the judgment of the tax advisor, not upon the OECD Guidelines.
Based on the above approach and comparability filter, the tax advisor regressed out COGs and financing of COGs from the pool’s companies. Based on these adjusted Operating Costs, the median net margin increased to 9.9 percent, but correspondingly applying to a smaller base. So what about the amount remaining after application of the agreed net margin. Therein lies the rub. Starbucks and the Netherlands tax administration agreed that the “residual profit” remaining after the application of the nine to twelve percent mark-up would be allocated to a Starbucks group member as an annual license fee (Alki LP). Unlike a traditional license arrangement of a percent of sales or a flat fee or some other portion of a base, the entire residual is attached to the value of the intangibles administered through Alki LP. Sounds not an arm’s length. But my research has a least anecdotally uncovered that it is potentially how affairs may be arranged between an arm’s length toll manufacturer and a powerful group in the context at least of some Asian toll manufacturers. I have not (yet) uncovered a comparable license relationship for a coffee roaster. But that does not lead me to conclude that no value be allocated to a license. Starbucks certainly has coffee roasting patents which represent hard intellectual property rights. I am interested in identifying comparable arrangements in terms of higher sourcing prices or a partial license rate for manufacturing, preferably coffee roasting, business know-how.
I have been asked several questions, a couple worth mentioning herein. (a) Why did SMBV take legal title to its raw materials (the green coffee beans) at all, because it could have just taken them on consignment? Starbucks in the EU decision stated that based on accounting principles a consignment would not have been generally accepted. (b) Could not SMBV have paid a higher transfer price for the source beans, and captured the trading profit in Switzerland which has a low tax rate (albeit not a ‘nil’ rate under which Alki LP operates). This aspect is not addressed in the decision but for the EU Commission alleging that the price paid above three percent is already too high. I think arguably SMBV had room in this respect based on academic literature about the specialty coffee industry. The value generated and allocated to sourcing and source branding relative to each other aspect of a global value chain is different for specialty coffee retailers than the general coffee retailers.
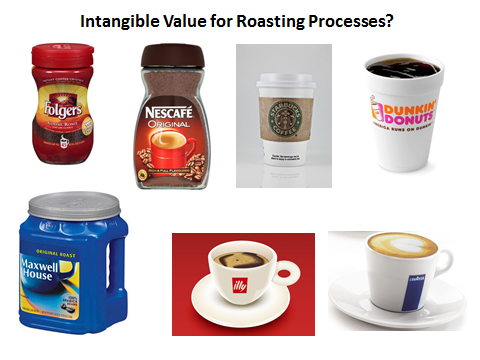
Coffee roasters and instant coffee manufacturers transform the coffee from green beans to roasted and instant. This roasting process usually takes place in consumption countries. In the EU it is done to a large extent by multinationals supplying several EU countries from their regional production facilities. The level of concentration within the roasting sector exceeds the level of concentration in the coffee trade itself. Some of the largest European roasters also maintain their own in-house buying companies (e.g. Taloca for Kraft): these roasters import coffee directly from origin, or they export coffee from origin. The Italian specialty roaster Illy also has important upstream operations in Brazil.
Example large coffee roasting companies include Nestlé (Nescafe, 28% global market), JAB (DouweEgberts, Mondelez, Peets, Caribou, Keurig, 20% of global market), JM Smucker (Folgers, Millstone), Kraft (Maxwell House, Sanka, Yuban), and Starbucks. These five are responsible for more than two-thirds of the roasted coffee market. The largest roasters (those with the largest market authority) tend to rely upon traders for their supply of coffee rather than dealing directly with producers or producer groups. Smaller roasters and particularly those serving the s
pecialty coffee sector exhibit a greater tendency to deal directly withproducers and their organizations in order to secure their supplies.
 The ‘sustainable chains’ (includingfair trade and other certifications) tend to be shorter than conventional food chains. They usuallyinclude agroup of farmers, an exporter, an importer/distributor and a specialized retailer. In some cases, the chain is even shorter when the group of producers exports directly to a roaster or even a retailer (see figure below). This type of short chains is typical of the fair-trade sector, where the declared goal is to reduce the number of middlemen to increase the profit margin at the farm gate level. This integration, which has been facilitated by rapid progress in information and communication technology, leads to increased profit margins at both ends of the chain. Some companies such as Starbucks and Nestle, have developed and implemented their own fair trade verification system. Starbucks has developed Coffee and Farmer Equity (C.A.F.E.) Practices. Nestle’s AAA Sustainable Quality Program draws on its relationships with its suppliers and partners.
Mentioned only as examples of value chain analysis by industry academics, a 2005 Italian coffee industry study found that within the global value chain, a roasting operation may attract 30 percent of the value. A 2015 study of the German coffee industry allocated only 6.23 percent to the roaster. Apples and oranges? Changing value per function over time? Surprising to me, not many coffee industry value chain studies in the academic literature, at least in English (Kluwer readers – please forward me any that you know of).
Draft research for an independent TNMM analysis
This section of my article will contain my results of a search for comparable taxpayers to SMBV. I have documented the search and evaluation process and have expository information about each of the taxpayers that are considered comparable. It is still in rudimentary draft form and needs to be validated and reviewed by outside economists, thus I am just presenting a brief view for this part 2 of my research project.
A search for comparable taxpayers is completed in four steps. In the first step, commercial or proprietary databases containing company information disclosed in public filings are searched for potentially comparable taxpayers based on the standard industrial classification (SIC) code (SIC 2095 for coffee roasters). These queries often result in a sample containing hundreds of companies, which must be reduced to a manageable size before the companies can be evaluated individually. I directed my research assistants, and with the kind assistance of database trainers, to query several financial and economic data repositories, including the Worldwide Private Company Database from Thomson Reuters, Bureau van Dijk’s Orbis, ktMINE, and RoyaltyStat. We generated different pools based on the repository. I am not going to disclose the specific data and results of these proprietary companies. They have been kind enough to allow me to do this academic research without fee. But I will include enough methodology description for others who subscribe to these companies economic data repositories to follow in my footsteps and undertake their own queries. In our step one, amalgamated results, the query generated a pool of over European-based coffee roaster operations. Besides the above SIC and regional selection, we limited our results to companies with results for 2013, 2014 and 2015. The APA is 2008 and thus we should examine data from 2005, 2006 and 2007. The price of green beans was increased in 2011, and thus we should examine 2010 and 2011. But that financial data is not as readily, robustly available and the past three years of 2013-15. However, my research assistants are busy determining if we can replicate our searches for those years and still have an appropriately large pool.
The second step requires undertaking bulk rejections through which clearly dissimilar taxpayers are removed from the sample by filtering. The database search such as the one conducted in step one establishes a broad sample of companies that are potentially comparable. By performing bulk rejections, groups of taxpayers that do not meet minimum defined comparability criteria can be removed from this sample. Specifically, two types of bulk rejections can be applied. The first type, qualitative rejections, removes taxpayers for whom critical financial data is not available. The second type, quantitative rejections, removes taxpayers from the sample based upon filters such as gross sales, assets and number of employees. I will include in the article a summary of the bulk rejections that were applied to the sample of comparable taxpayer data established in step one. By example, companies were rejected because the consolidated and unconsolidated net sales are missing for two or more years from our data pool.
In the third step, information associated with each of the remaining comparable taxpayers is reviewed at a high-level, followed by another removal of dissimilar taxpayers from the sample. The purpose of the third step is to eliminate taxpayers from the data set that are not engaged in business activities comparable to those being benchmarked. In order to remove these taxpayers from consideration, the available information about each potential comparable taxpayer must be reviewed. While it is possible for a taxpayer to meet multiple rejection criteria, a taxpayer can be rejected only once. By example, companies with a significantly smaller scale of operation were rejected, and then companies that engaged in various business lines.
In the fourth and final step, the business activities of the remaining taxpayers in the sample are compared in detail to those of the business unit being benchmarked. The taxpayers that remain after bulk rejections and the first comparability review are most likely to be comparable. To make the final determination of each taxpayer’s comparability, an in-depth evaluation of the taxpayer’s activities must be conducted using detailed data from public filings, annual reports and industry analysis reports.
Briefly, some findings
Using just the pool of 2015 company financial data and analysis tools, we undertook two regressions: study the relationship of Operating P/L [=EBIT] over P/L [=Net Income] and Operating P/L [=EBIT over Gross Margin (%). I think of this as the Commission perspective wherein it dismisses SMBV’s contentions of a value allocation for the roasting know-how (an IP right) and operational know how (an intangible). Based on such perspective and our current pool of data, albeit a mismatch of years, it appears that in both regressions that the Netherlands roaster operation has underperformed when compared to European comparables. In the regression where Gross Margin is the dependent variable, the tested firm’s real gross margin is below the industry’s average and below the regression’s calculated value. The comparison of SMBV to the range generated from potential comparable competitors has so far found a slope that represents the rate of change between both of our variables or the industry average at that particular level of whatever X is. In the first regression, for every 1 more unit of EBIT (X), net income should increase 1.05. A correlation coefficient close to 1 shows a strong correlation. The second regression used a gross margin instead of net income and still found SMBV under-performing relative to the comparable competitors. In conclusion, the results thus far depict a strong positive association for the correlation between net Income and EBIT. Firms with higher EBIT are more likely to have higher net income.
The comparison of SMBV to the range generated from potential comparable competitors has so far found a slope that represents the rate of change between both of our variables or the industry verage at that particular level of whatever X is. In the first regression, for every 1 more unit of EBIT (X), net income should increase 1.05. A correlation coefficient close to 1 shows a strong correlation. The second regression used a gross margin instead of net income and still found SMBV under-performing relative to the comparable competitors. So in applying a EU Commission perspective filter, perhaps unsurprisingly, the results thus far depict a strong positive association for the correlation between Net Income and EBIT. Firms with higher EBIT are more likely to have higher net income. Understandably, though our pool of companies is very large, we have received feedback that our regressions are too basic at this stage to be yet meaningful.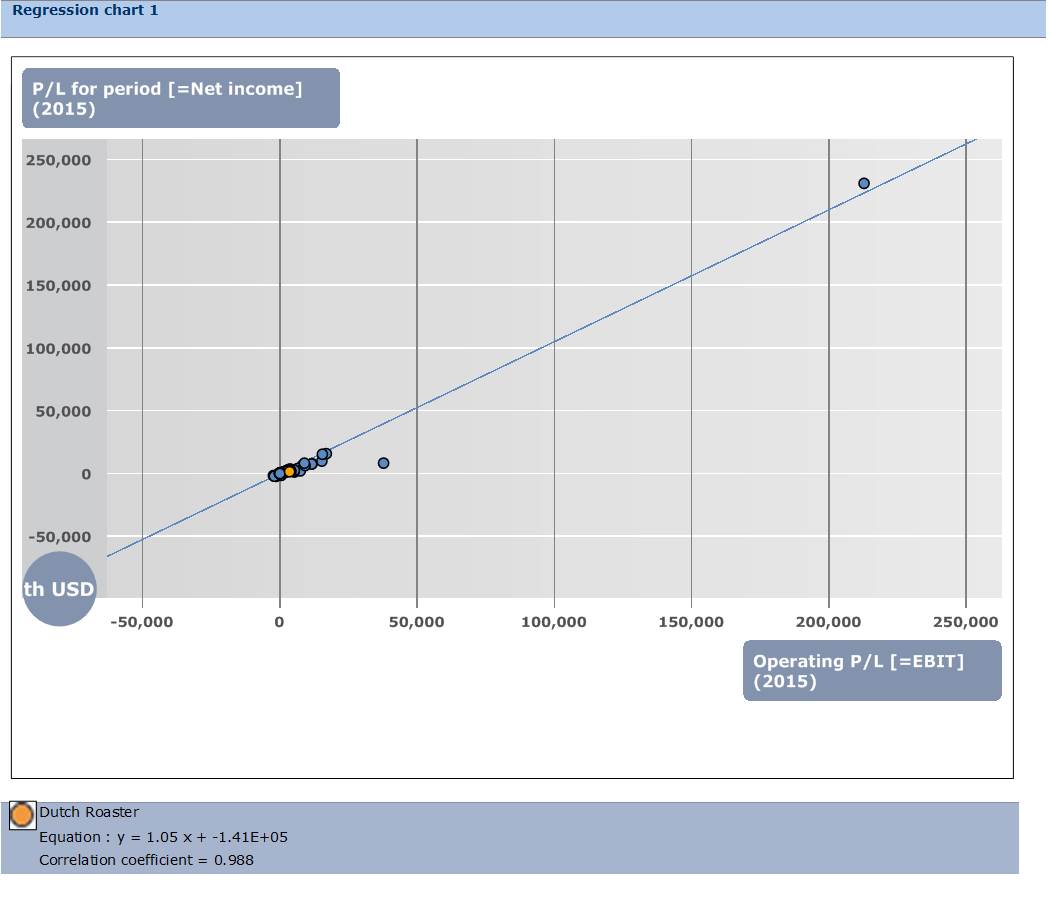
And every dispute has at least two perspectives. What will happen if we are able to adjust the data for the comparables based upon Starbucks contention of the licensing value of its ‘know how’ IP and operational intangible, and to discount the value by the ancillary non-coffee administrative convenience activities? If Starbucks low-value services contentions are accepted, then the question falls to an arm’s length determination for the apportionment of the ‘residual income’ of SMBV after the transactional net margin for the roasting function of SMBV. That is data yet to be collected. Until part 3.
________________________
To make sure you do not miss out on regular updates from the Kluwer International Tax Blog, please subscribe here.
Kluwer International Tax Law
The 2022 Future Ready Lawyer survey showed that 78% of lawyers think that the emphasis for 2023 needs to be on improved efficiency and productivity. Kluwer International Tax Law is an intuitive research platform for Tax Professionals leveraging Wolters Kluwer’s top international content and practical tools to provide answers. You can easily access the tool from every preferred location. Are you, as a Tax professional, ready for the future?
Learn how Kluwer International Tax Law can support you.

Dear William,
My approach would start by finding out who is the tax authority concerned. The Dutch-USA-tax-contract-1948 gives that information.
In short the country from where the boss bosses is the tax authority. The same in international civil law. BP’s subsidiaries make a mess in the Mexican gulf, Shell subsidiaries do so in Nigeria, BP resp. Shell is the ultimate responsible body.
So the tax authority concerned is the USA. That is the sole authority that can tax.
However, article III of the tax contract leaves some “leftovers” to the country where there are activities. But in a way that there is no tax base untaxed. That means that or the USA taxes or Holland.
So in the assumption Holland did not tax enough tax base, its the USA that sends the tax bill.
Only in that limited dutch taxable area the transfer pricing rules apply.
Succes & Regards,
Rop
Thank you for your comment. U.S. Treasury agrees with your point (see my previous post from January: https://kluwertaxblog.com/2016/01/26/will-the-us-impose-double-us-tax-rates-on-eu-companies-from-countries-that-retroactively-impose-state-aid-claw-backs/ )
The EU Commission though has approached this case as a State Aid – Competition case, not as a tax case. The anti-competitive benefit, alleges the EU Commission, has been provided through a reduction in the tax base. Thus, from its perspective, the EU challenges a tax incentive regime. From the Tax Authority perspective, the Advance Pricing Agreement is merely an internationally accepted mechanism for establishing certainty as to the discernment, based on underlying market data, of the arm’s length relationship between parties.