This is the first part of a series about numbers in transfer pricing. In this edition, I look at sticking the TP five methods on a typical profit and loss account (hereafter “P&L”). I find it curious that we do not see a lot more of this around, as I believe it is essential to the understanding of most of the methods and their application.
An average P&L
First (for the benefit of lawyers like me), let us list the main components of a typical P&L. Those components and their basic definitions are:
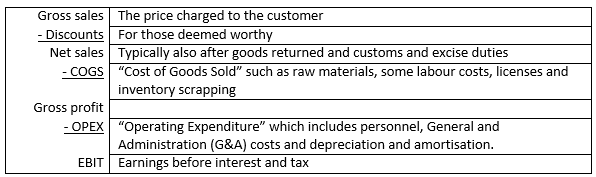
Different companies may use different variations of the above, but the basic format and order will be similar to the above.
General observations about comparability of P&L’s
It is important to realise that:
1. different people may use different names for the same thing (think Gross profit vs Contribution, or Net operating profit vs EBIT) or may use the same name for different things;
2. there will be far more accounts in the P&L of an average MNE: they may have anything from 200 to 1000 account numbers;
3. an MNE typically has many different sets of accounts and each of those can have their own account numbers, account names and layout.
a. In most MNE’s I have seen, local subsidiaries have local accounts with different account names and different numbers from the consolidated account names and numbers. E.g. a manufacturing subsidiary may have almost no accounts between Gross sales and Net sales or even Gross profit, but extremely many detailed accounts on OPEX in order to track the exact cost per product produced. This can range from a detailed split of personnel by activity and by product to very accurate depreciation schedules for machinery by product and or detailed allocation schedules of R&D by product line. A distributing subsidiary may have very little of these, but far more detailed breakdowns of posts between Gross sales and Gross profits, including e.g. marketing spent by product or several sub-categories of license fees for trademarks.
b. These local accounts feed into the group consolidated accounts, kept by the head office and often running on a different platform than the local subsidiaries’ accounts. Local subsidiaries feed their accounts into the consolidated accounts through a process called mapping and as different subsidiaries may subdivide their own accounts differently from each other, a consolidated account (e.g. on intercompany purchases) may represent 3 different accounts in one subsidiary and only 1 in another.
c. When looking at external comparables, it may be important to realise which accounts you are dealing with. Acceptable comparables will mostly be stand-alone companies of which the P&L far more resembles the local accounts of subsidiaries than consolidated group accounts;
4. finally, it is important to realise that the same post may be hosted at different levels of the P&L by different companies. The classical example here would be where one sales company include a part of its personnel costs under COGS which another allocates it to OPEX (see table above).
It is important when doing comparability analyses between companies, to compare apples with apples and not pears.
Where do TP methods belong on the P&L?
The following is based on a very practical approach, not necessarily technically perfect one. Graphically, the text below could be represented as follow:
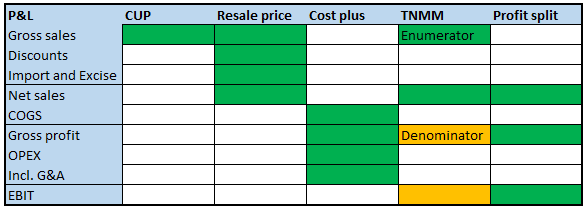
The Comparable Uncontrolled Price (“CUP”) method is located at the top of the P&L at the Gross sales level. Generally, the closer to the top, the better. If one can compare the shop price of an article with one’s own identical article that may be best. However, what if the price is not the shop price, but a B2B price? Suddenly the many accounting lines between Gross sales and Net sales become important. E.g. does my comparable price include or exclude import and excise duties or is it with or without discounts. The difference between an uncontrolled price with none of these and one with all of them can easily be 40% to 50%.
It is further important to realise that our sales company is then supposed to cover all its costs below the CUP peg from the sales price received. E.g. if it was determined that the comparable uncontrolled sale was priced ex discounts and import and excise duties, our company should cover its own discounts, import and excise duties, COGS, OPEX and targeted profit margin from that price.
This may be a bitter pill for tax authorities to swallow, if they want our sales company to be just as profitable as the company behind our comparable uncontrolled price: there is a long distance down the P&L from Gross/Net sales to EBIT and huge room for variations: a CUP requires similarity at the top of the P&L, not the bottom (though one could go some way with the help of comparability criteria in a functional analysis).
The resale price method also resides at the top of the P&L. Our sales company may for instance buy toasters from a third party, XCo, and sell them to third parties with a mark-up of 10%. If it then also buys similar toasters from a group company, its profit margin on those toasters should be 10% as well. As is the case with the XCo profit margin, the internal profit margin should be sufficient to finance our sales company’s COGS (other than the toasters), OPEX and desired EBIT as well. Once again, the distance down the P&L from Gross profit plus other COGS (or Net sales plus the toasters) down to EBIT, is big enough to make the outcome of EBIT uncertain and by no means guaranteed.
Next would be the cost plus method which focuses on services more than sales and therefore often finds its basis further down the P&L, around G&A and OPEX. As such it sits closer to EBIT with less room for uncertainty. It therefore is generally easier to hit a targeted EBIT under a cost plus method.
The Transactional Net Margin Method (TNMM) is a different beast in that it is split over the P&L. As the word margin implies it is something divided by something else. Typically, the numerator of this fraction resides close to the top of the P&L somewhere between Gross sales and Net sales (leaving balance sheet based TNMM’s aside for the moment). The denominator typically hops down to somewhere below Gross profit. The predictability of the method is steered by how close the denominator is to the bottom of the P&L and the numerator is to the top.
There may be many technical arguments against such a simplified approach to the TNMM. However, the fact is that as long as tax authorities adjustments are motivated by the EBIT or even the EBT of taxpayers, this is the safest modus operandi, as it come closest to guaranteeing the targeted return.
Finally, there is the profit split method, where profits may be split along different levels of the P&L in a contribution split, but will typically lie between. Net sales and Gross profit. It could include OPEX as well, if parties are prepared to carry the risk of each other’s inefficiencies. Due to its inclusion of resale price, cost plus and TNMM, a residual profit split will cover the whole of the P&L.
Coming up next
In my next posts, I will focus more on the difficulties of applying contractual terms on arm’s length pricing to P&L items and calculations, the effects of budget to actual variances, and possible risk management tools.
________________________
To make sure you do not miss out on regular updates from the Kluwer International Tax Blog, please subscribe here.
Kluwer International Tax Law
The 2022 Future Ready Lawyer survey showed that 78% of lawyers think that the emphasis for 2023 needs to be on improved efficiency and productivity. Kluwer International Tax Law is an intuitive research platform for Tax Professionals leveraging Wolters Kluwer’s top international content and practical tools to provide answers. You can easily access the tool from every preferred location. Are you, as a Tax professional, ready for the future?
Learn how Kluwer International Tax Law can support you.